Rice Science ›› 2020, Vol. 27 ›› Issue (4): 315-328.DOI: 10.1016/j.rsci.2020.05.007
• Research Paper • Previous Articles Next Articles
Karmakar Aritra1, Bhattacharya Sananda1, Sengupta Shinjini1, Ali Nusrat1,2, Nath Sarkar Sailendra1, Datta Karabi1, K. Datta Swapan1( )
)
Received:2019-03-11
Accepted:2019-06-18
Online:2020-07-28
Published:2020-03-31
Karmakar Aritra, Bhattacharya Sananda, Sengupta Shinjini, Ali Nusrat, Nath Sarkar Sailendra, Datta Karabi, K. Datta Swapan. RNAi-Mediated Silencing of ITPK Gene Reduces Phytic Acid Content, Alters Transcripts of Phytic Acid Biosynthetic Genes, and Modulates Mineral Distribution in Rice Seeds[J]. Rice Science, 2020, 27(4): 315-328.
Add to citation manager EndNote|Ris|BibTeX
| Primer name | Sequence | Amplicon size |
|---|---|---|
| RT ITP5/6K-1F RT ITP5/6K-1R | 5’ ATGAGGGTGCACGAGGAG 3’ 5’ TCTTCTTGGTCAGGGCGTAG 3’ | 160 bp |
| RT IPK1F RT IPK1R | 5’ ACACTGGCTCGTCACCTTCT 3’ 5’ ATGATTGGCACCCAAATGTT 3’ | 215 bp |
| RT IMP1F RT IMP1R | 5’ GTTGGCCTTGAACATGTGTG 3’ 5’ CTTCGTGCCATCAGATCAA 3’ | 165 bp |
| RT RINO1F RT RINO1 R | 5’ CTTTCCGCACCTCAAACATT 3’ 5’ TGCTGTCTCCAACATACGG 3’ | 151 bp |
| RT ITPK2-F RT ITPK2-R | 5’ GGTCCTCCAGGAATTTGTGA 3’ 5’ GGTCTGCATGGTCTGCACTA 3’ | 185 bp |
| RT ITPK3-F RTITPK3-R | 5’ TTAGTGGCAAAGCCTCTGGT 3’ 5’ ACCTACGCACAACCCGTATC 3’ | 169 bp |
| RT ITPK4-F RT ITPK4-R | 5’ GCCTGCACCTGTTCAACTTC 3’ 5’ ACGGAGCATCTCAAGGAAGA 3’ | 152 bp |
| RT ITPK5-F RT ITPK5-R | 5’ GTCCTCCAGGAGTTCGTCAA 3’ 5’ AGACCTGGGAGAAGGAGAGG 3’ | 157 bp |
| RT ITPK6 F RTITPK6-R | 5’ AGAGAGGAGCATTCCCCATT 3’ 5’ CCTTCGGAAAACTGATGATGGAA 3 | 168 bp |
| β tubulin F β tubulin R | 5’ GGAGTCACATGCTGCCTAAGGTT 3’ 5’ TCACTGCCAGCTTACGGAGG 3’ | 66 bp |
Supplemental Table 1. Primers list in quantitative real-time analysis.
| Primer name | Sequence | Amplicon size |
|---|---|---|
| RT ITP5/6K-1F RT ITP5/6K-1R | 5’ ATGAGGGTGCACGAGGAG 3’ 5’ TCTTCTTGGTCAGGGCGTAG 3’ | 160 bp |
| RT IPK1F RT IPK1R | 5’ ACACTGGCTCGTCACCTTCT 3’ 5’ ATGATTGGCACCCAAATGTT 3’ | 215 bp |
| RT IMP1F RT IMP1R | 5’ GTTGGCCTTGAACATGTGTG 3’ 5’ CTTCGTGCCATCAGATCAA 3’ | 165 bp |
| RT RINO1F RT RINO1 R | 5’ CTTTCCGCACCTCAAACATT 3’ 5’ TGCTGTCTCCAACATACGG 3’ | 151 bp |
| RT ITPK2-F RT ITPK2-R | 5’ GGTCCTCCAGGAATTTGTGA 3’ 5’ GGTCTGCATGGTCTGCACTA 3’ | 185 bp |
| RT ITPK3-F RTITPK3-R | 5’ TTAGTGGCAAAGCCTCTGGT 3’ 5’ ACCTACGCACAACCCGTATC 3’ | 169 bp |
| RT ITPK4-F RT ITPK4-R | 5’ GCCTGCACCTGTTCAACTTC 3’ 5’ ACGGAGCATCTCAAGGAAGA 3’ | 152 bp |
| RT ITPK5-F RT ITPK5-R | 5’ GTCCTCCAGGAGTTCGTCAA 3’ 5’ AGACCTGGGAGAAGGAGAGG 3’ | 157 bp |
| RT ITPK6 F RTITPK6-R | 5’ AGAGAGGAGCATTCCCCATT 3’ 5’ CCTTCGGAAAACTGATGATGGAA 3 | 168 bp |
| β tubulin F β tubulin R | 5’ GGAGTCACATGCTGCCTAAGGTT 3’ 5’ TCACTGCCAGCTTACGGAGG 3’ | 66 bp |
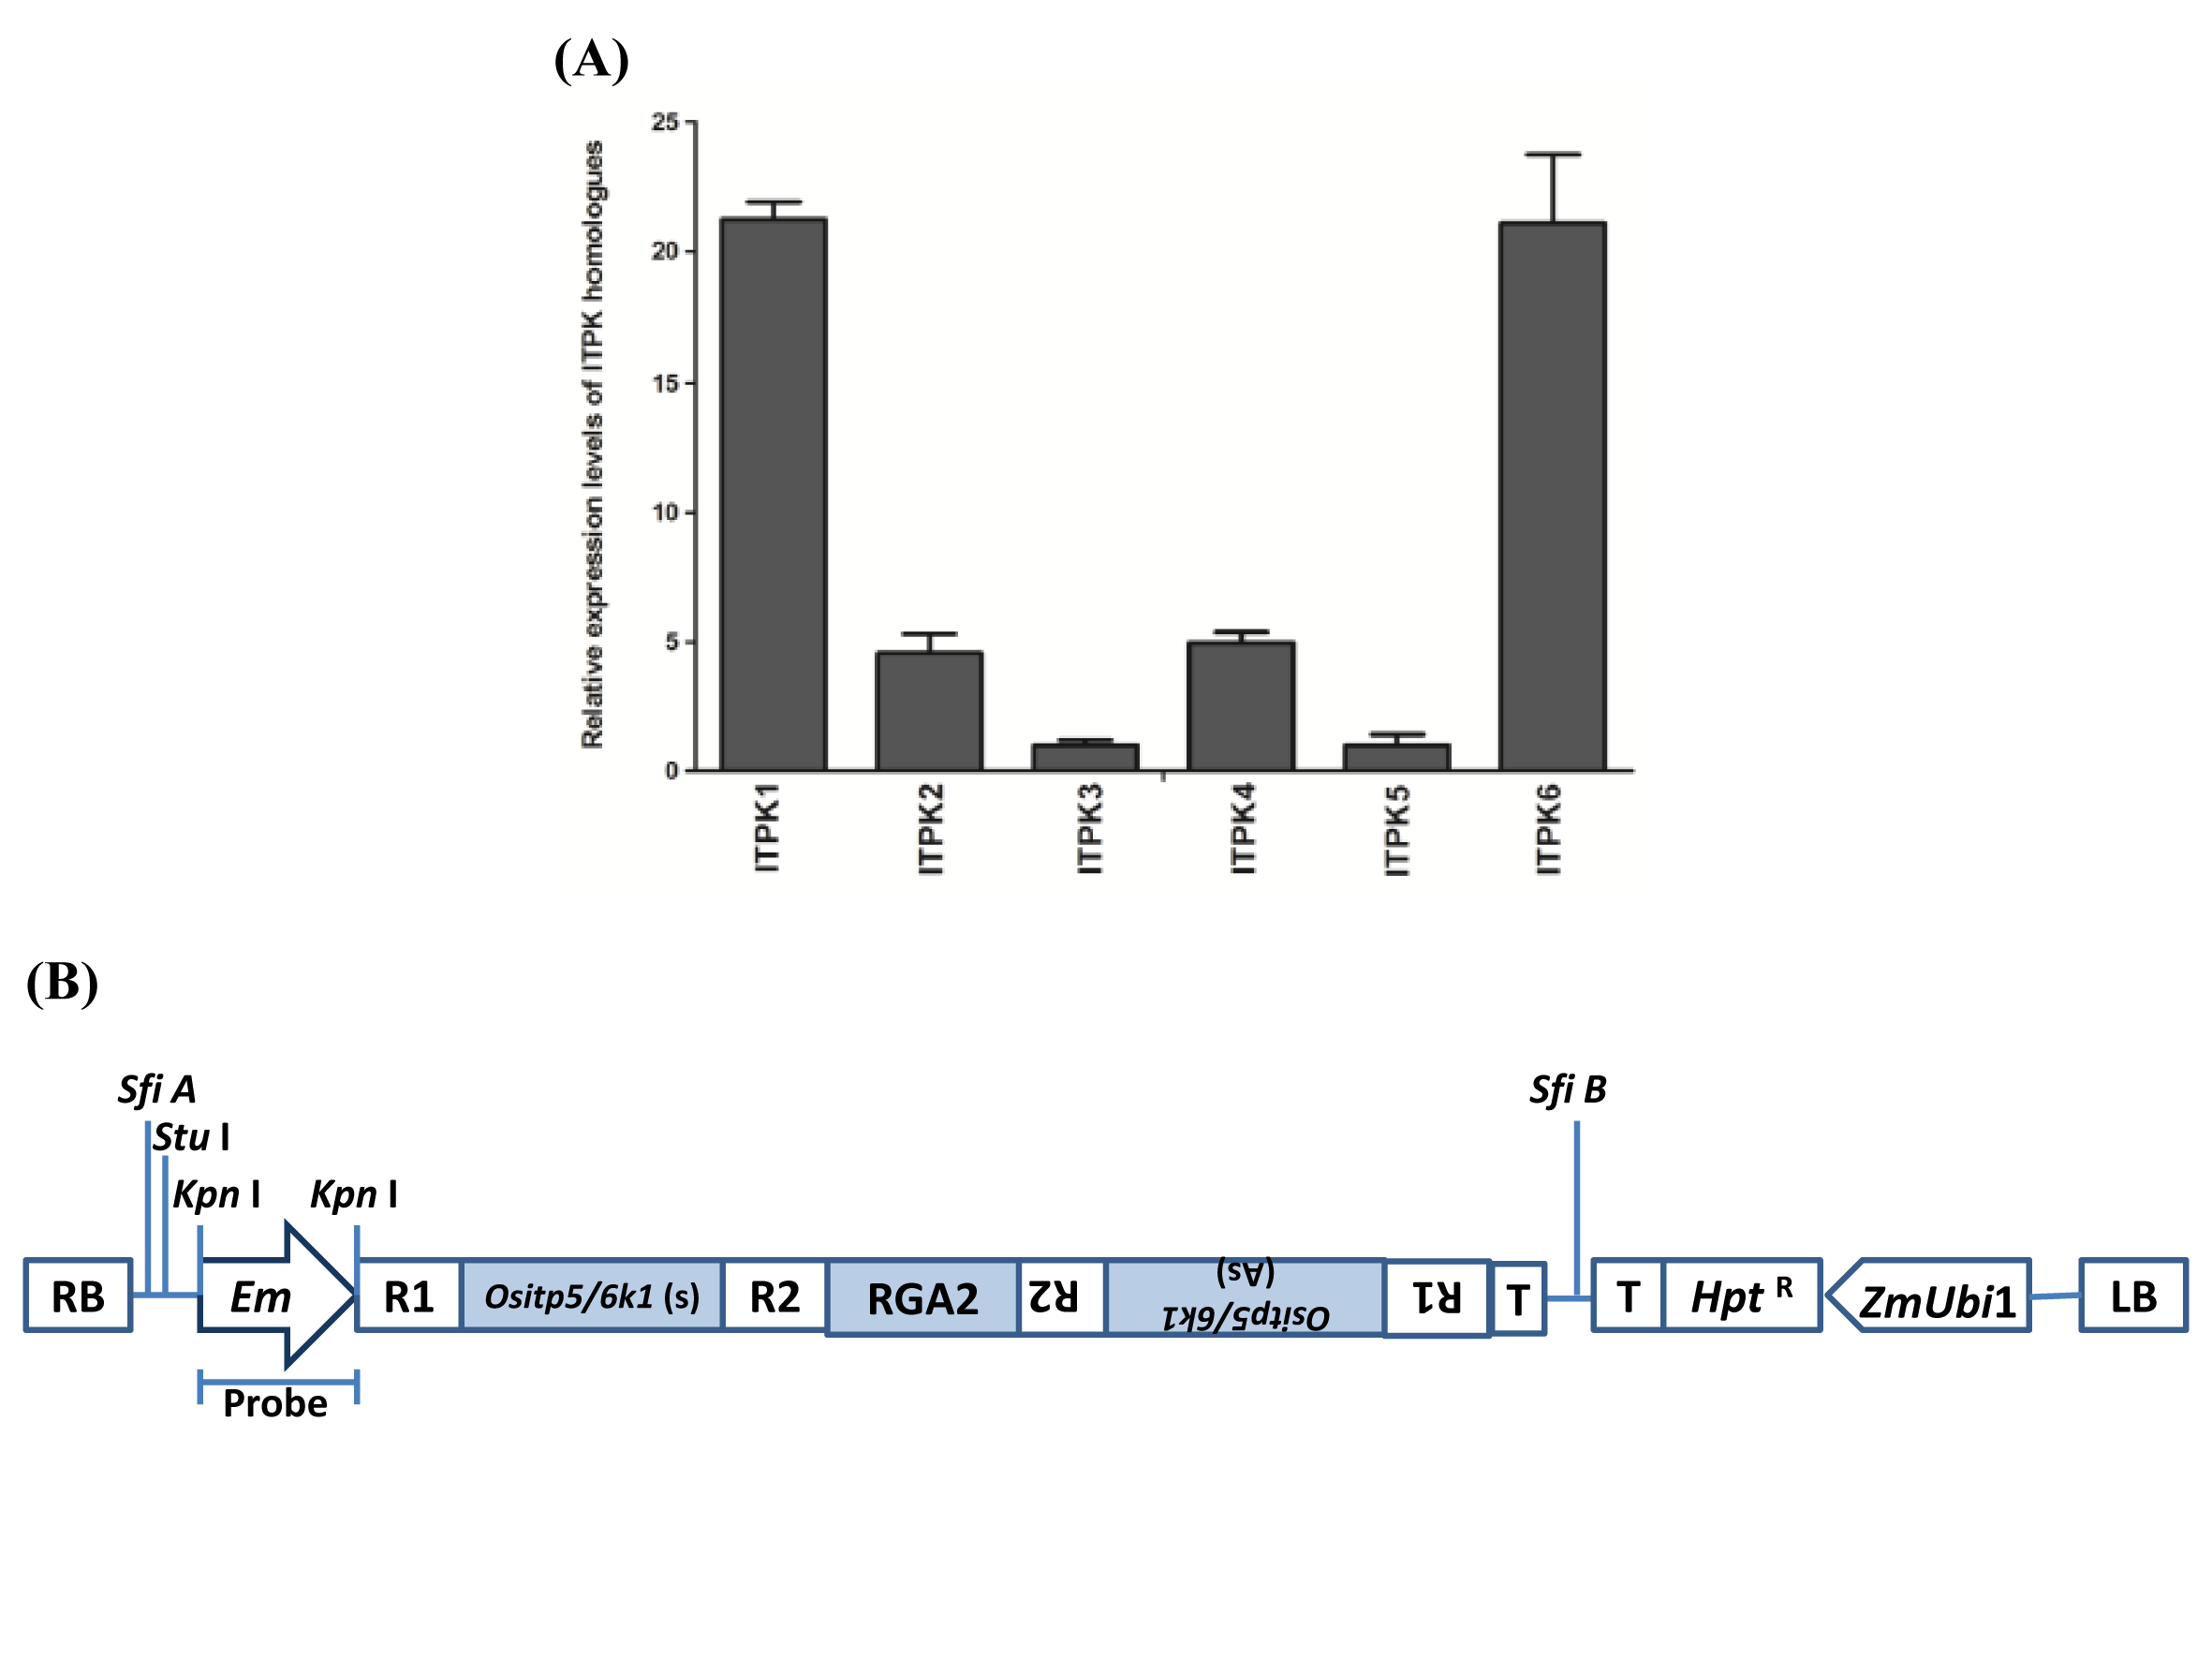
Supplemental Fig. 1. The expression pattern of OsITPK homologues and RNAi vector map.A, Expression levels of ITPK homologues of rice in mature seed of Oryza sativa L. subspecies indica cv. Khitish. B, Schematic diagram of pIPKb006 RNAi vector construct used for rice transformation, pEm-ITP5/6K-1-NOS vector contains ITP5/6 K-1 gene cloned in sense (s) and antisense (As) orientation, separated by wheat RGA2 intron. (Hpt- hygromycin phosphotransferase gene used as plant selection marker, T- CaMV35s terminator, R1 and R2 - recombination attachment sites in sense and anti-sense orientation).
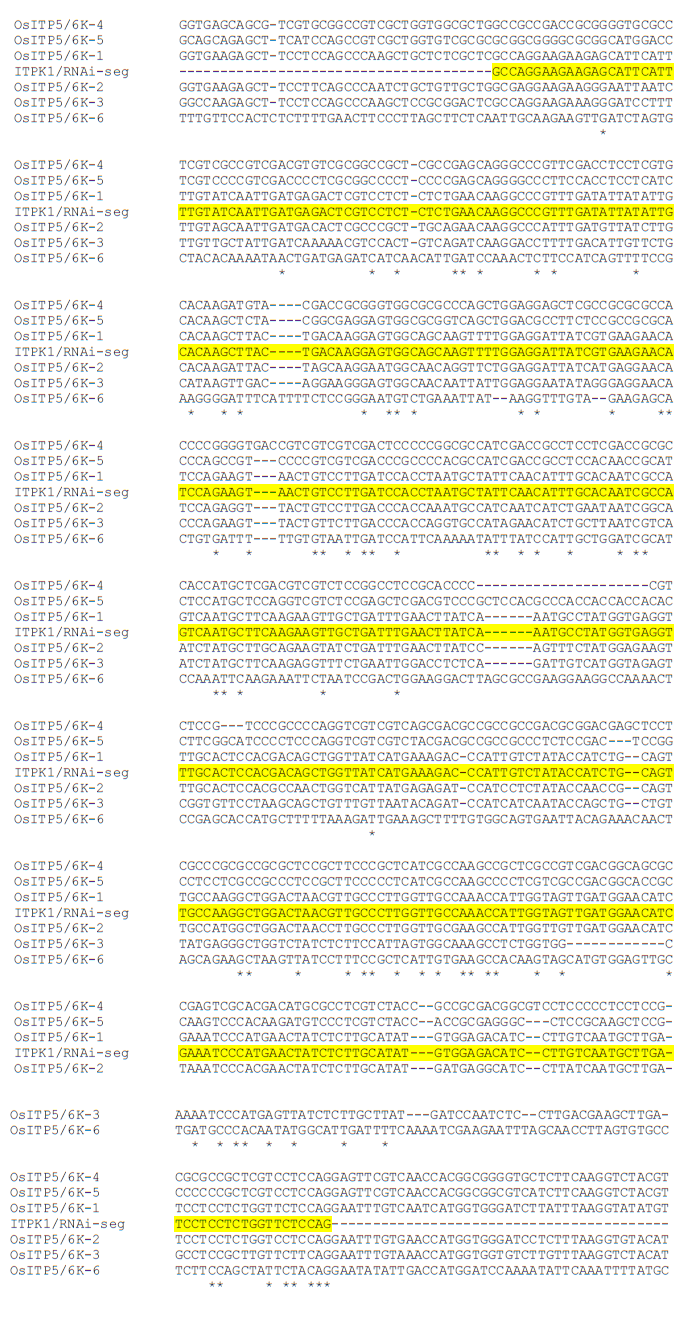
Supplemental Fig. 2. Multiple sequence alignment of six rice ITPK homologues and ITP5/6K-1 RNAi sequence using CLUSTALW (www.genome.jp/tools/clustalw/). Identical nucleotides are indicated by (*).
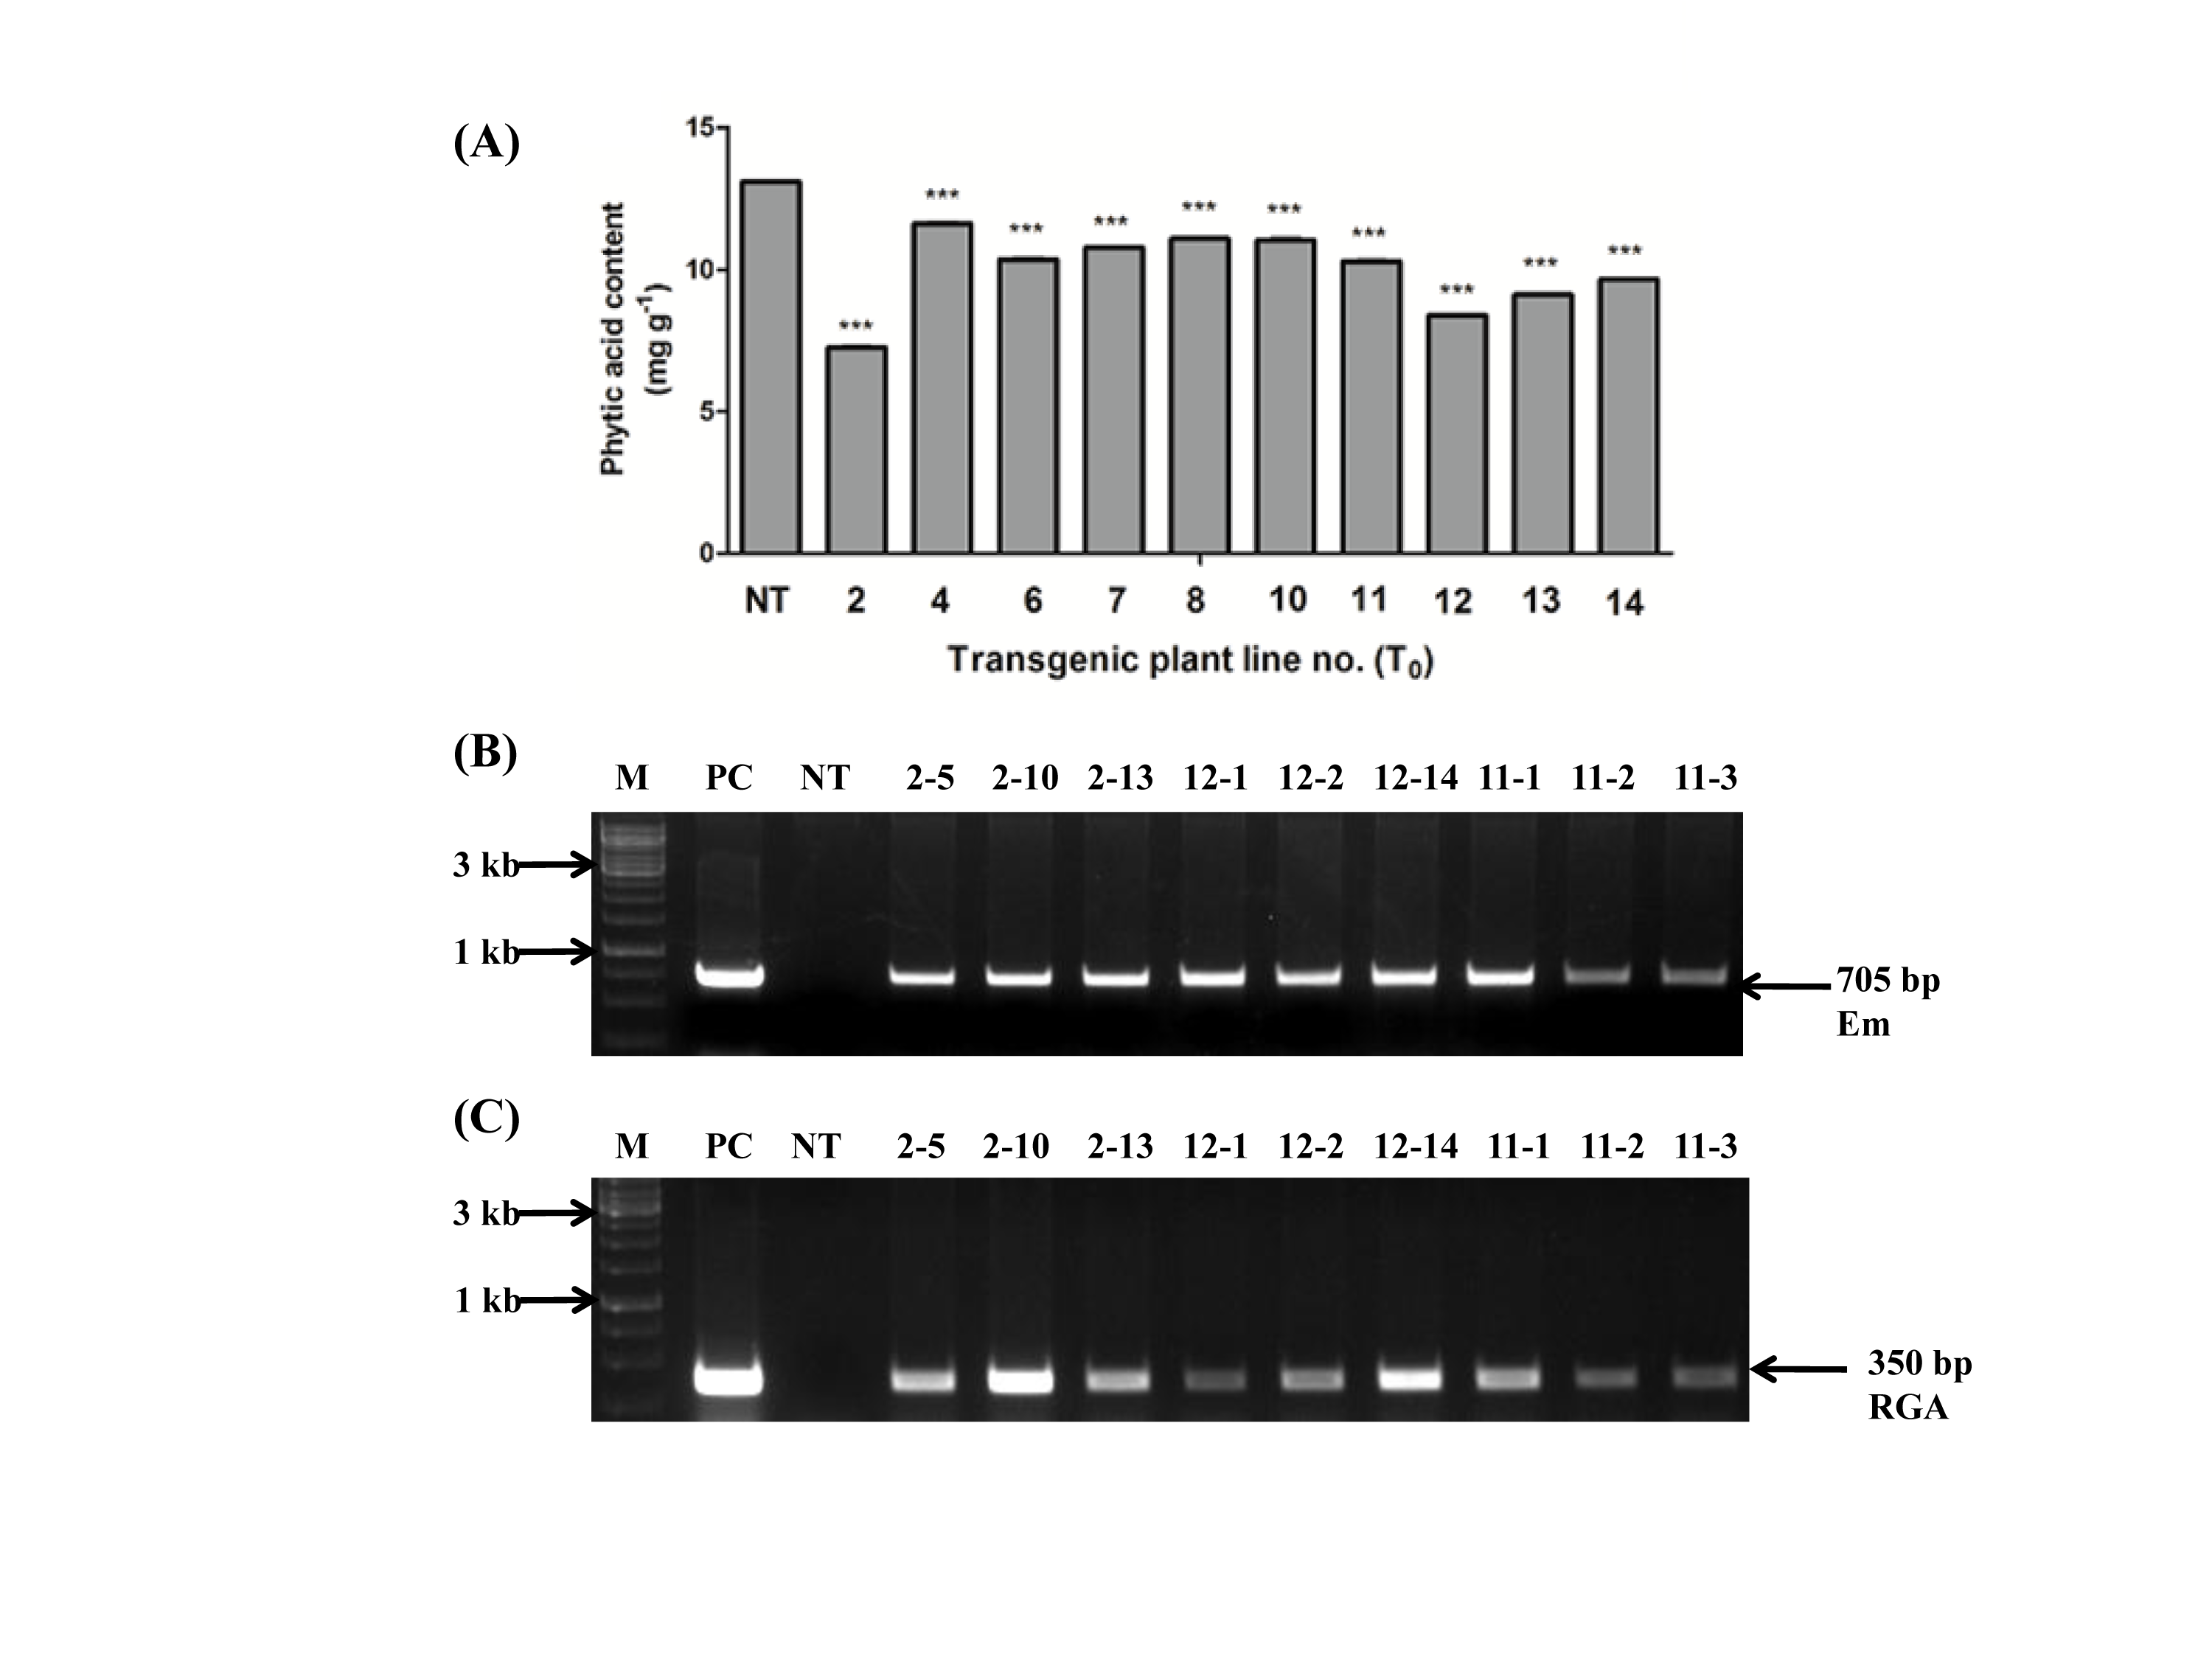
Supplemental Fig. 3. Screening of transgenic plants based on PCR and biochemical analysis.(A) Screening of Transgenic lines (T0) based on Phytic acid (PA) content. Transgenic (T0) lines screened based on PA content of T1 seeds obtained from respective T0 transgenic lines and compared with respect to non-transgenic control seeds (NT). The symbol*** indicates significant difference at P<0.05, (n=3). (B) Gel picture of PCR screening analysis of transgenic rice plants (T1) showing bands of wheat Em promoter (705 bp). (C) PCR screening for RGA2 intron (350 bp). (M -1 kb gene ruler, PC- Positive control, NT - Non-transgenic plant).
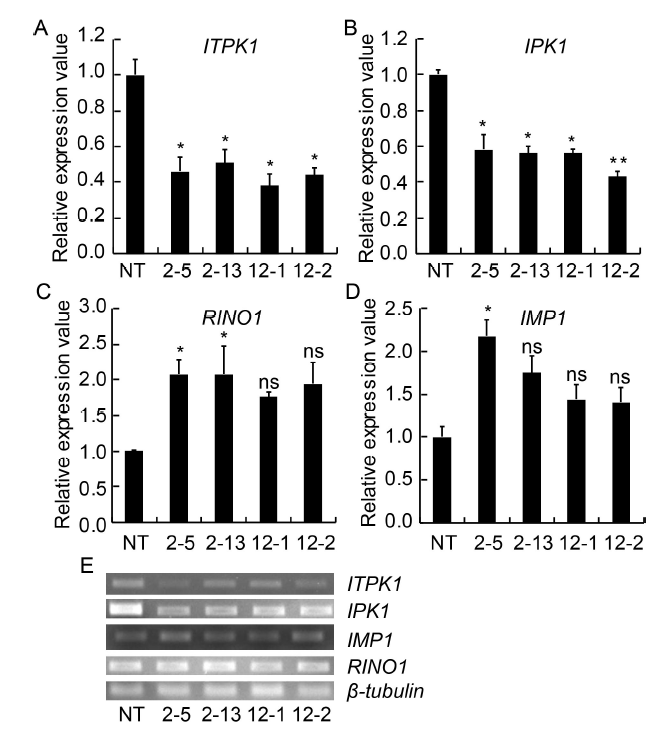
Fig. 1. Expression analysis of different genes of phytic acid biosynthesis pathway in selected RNAi transgenic as compared to non-transgenic (NT) control.All values were normalized using β-tubulin as the reference gene.2-5, 2-13, 12-1 and 12-2 are positive T2 plants IEIT1-2-5, IEIT1-2-13, IEIT1-12-1 and IEIT1-12-2, respectively.Values are presented as Mean ± SE (n = 3). * and ** indicate significant differences at the 0.05 and 0.01 levels, respectively, and ns indicates non-significant difference at the 0.05 level.
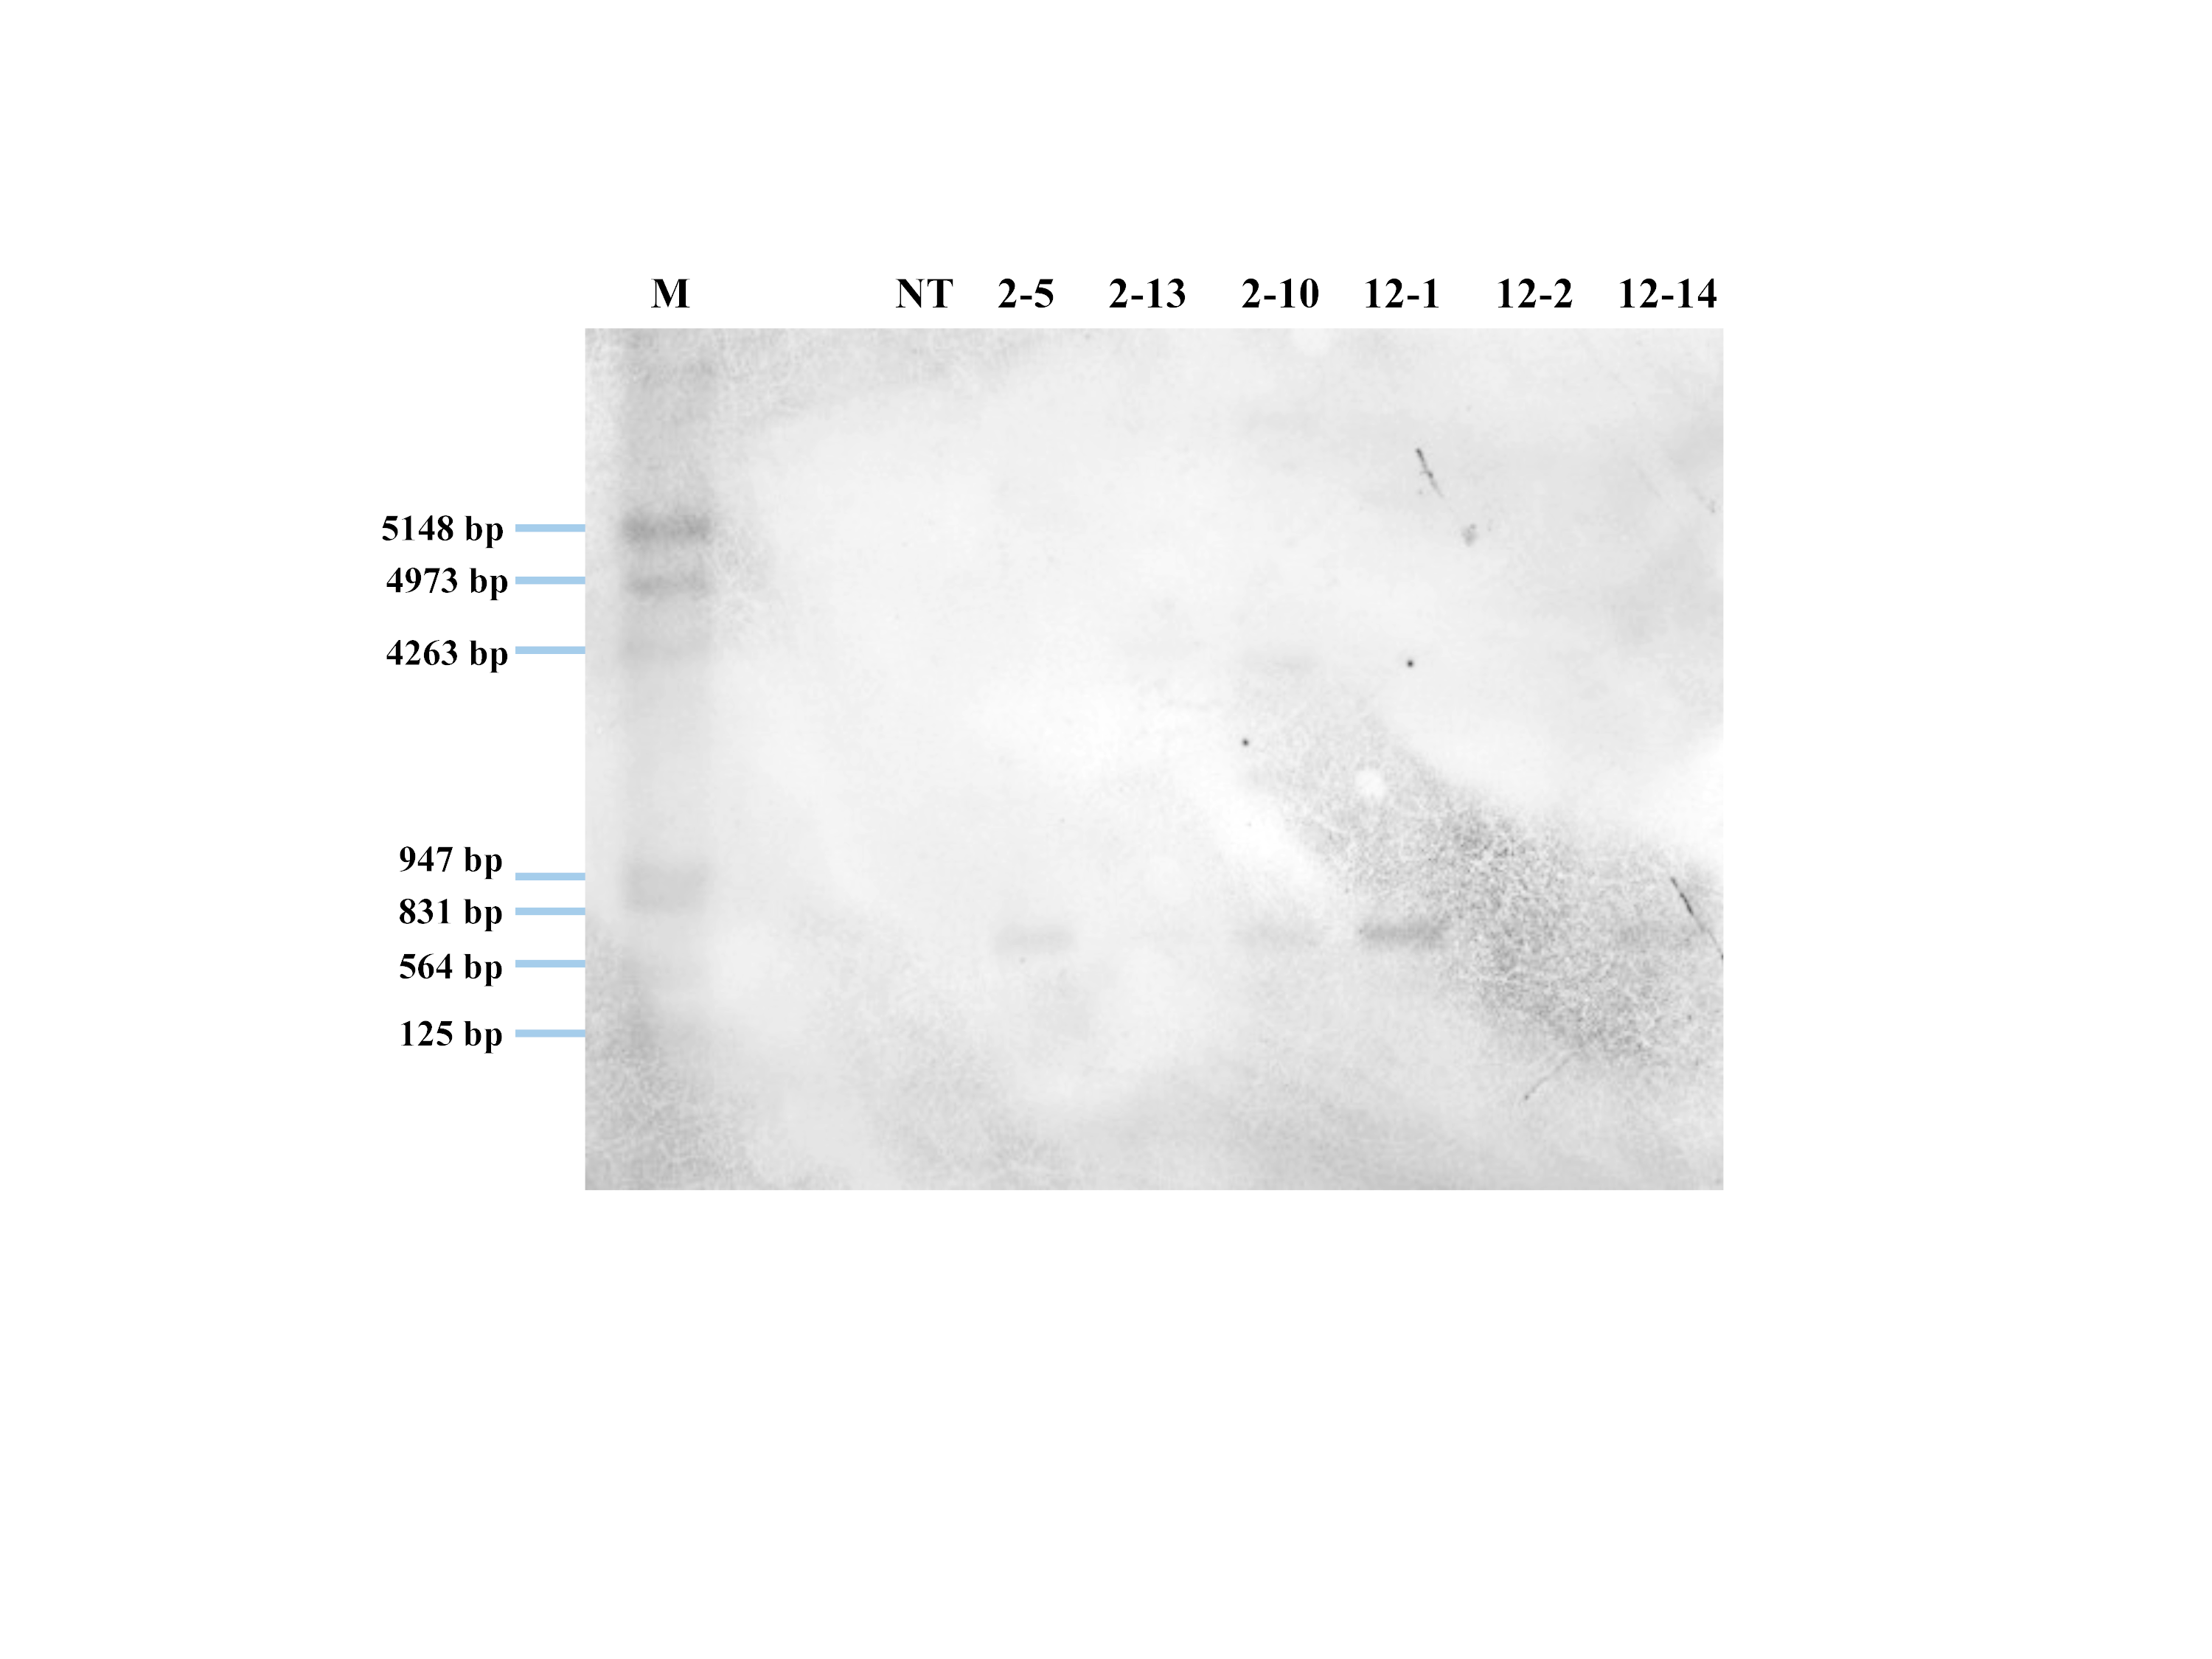
Supplemental Fig. 4. Southern blot analysis of transgenic plants (T2).The hybridized probe bands of Em promoter indicates stable integration of transgene in transgenic rice plants. No hybridization band was observed in non-transgenic control plant. 15 µg of genomic DNA was digested with StuI restriction enzyme and hybridized with Em promoter probe (DIG-11dUTP labelled).
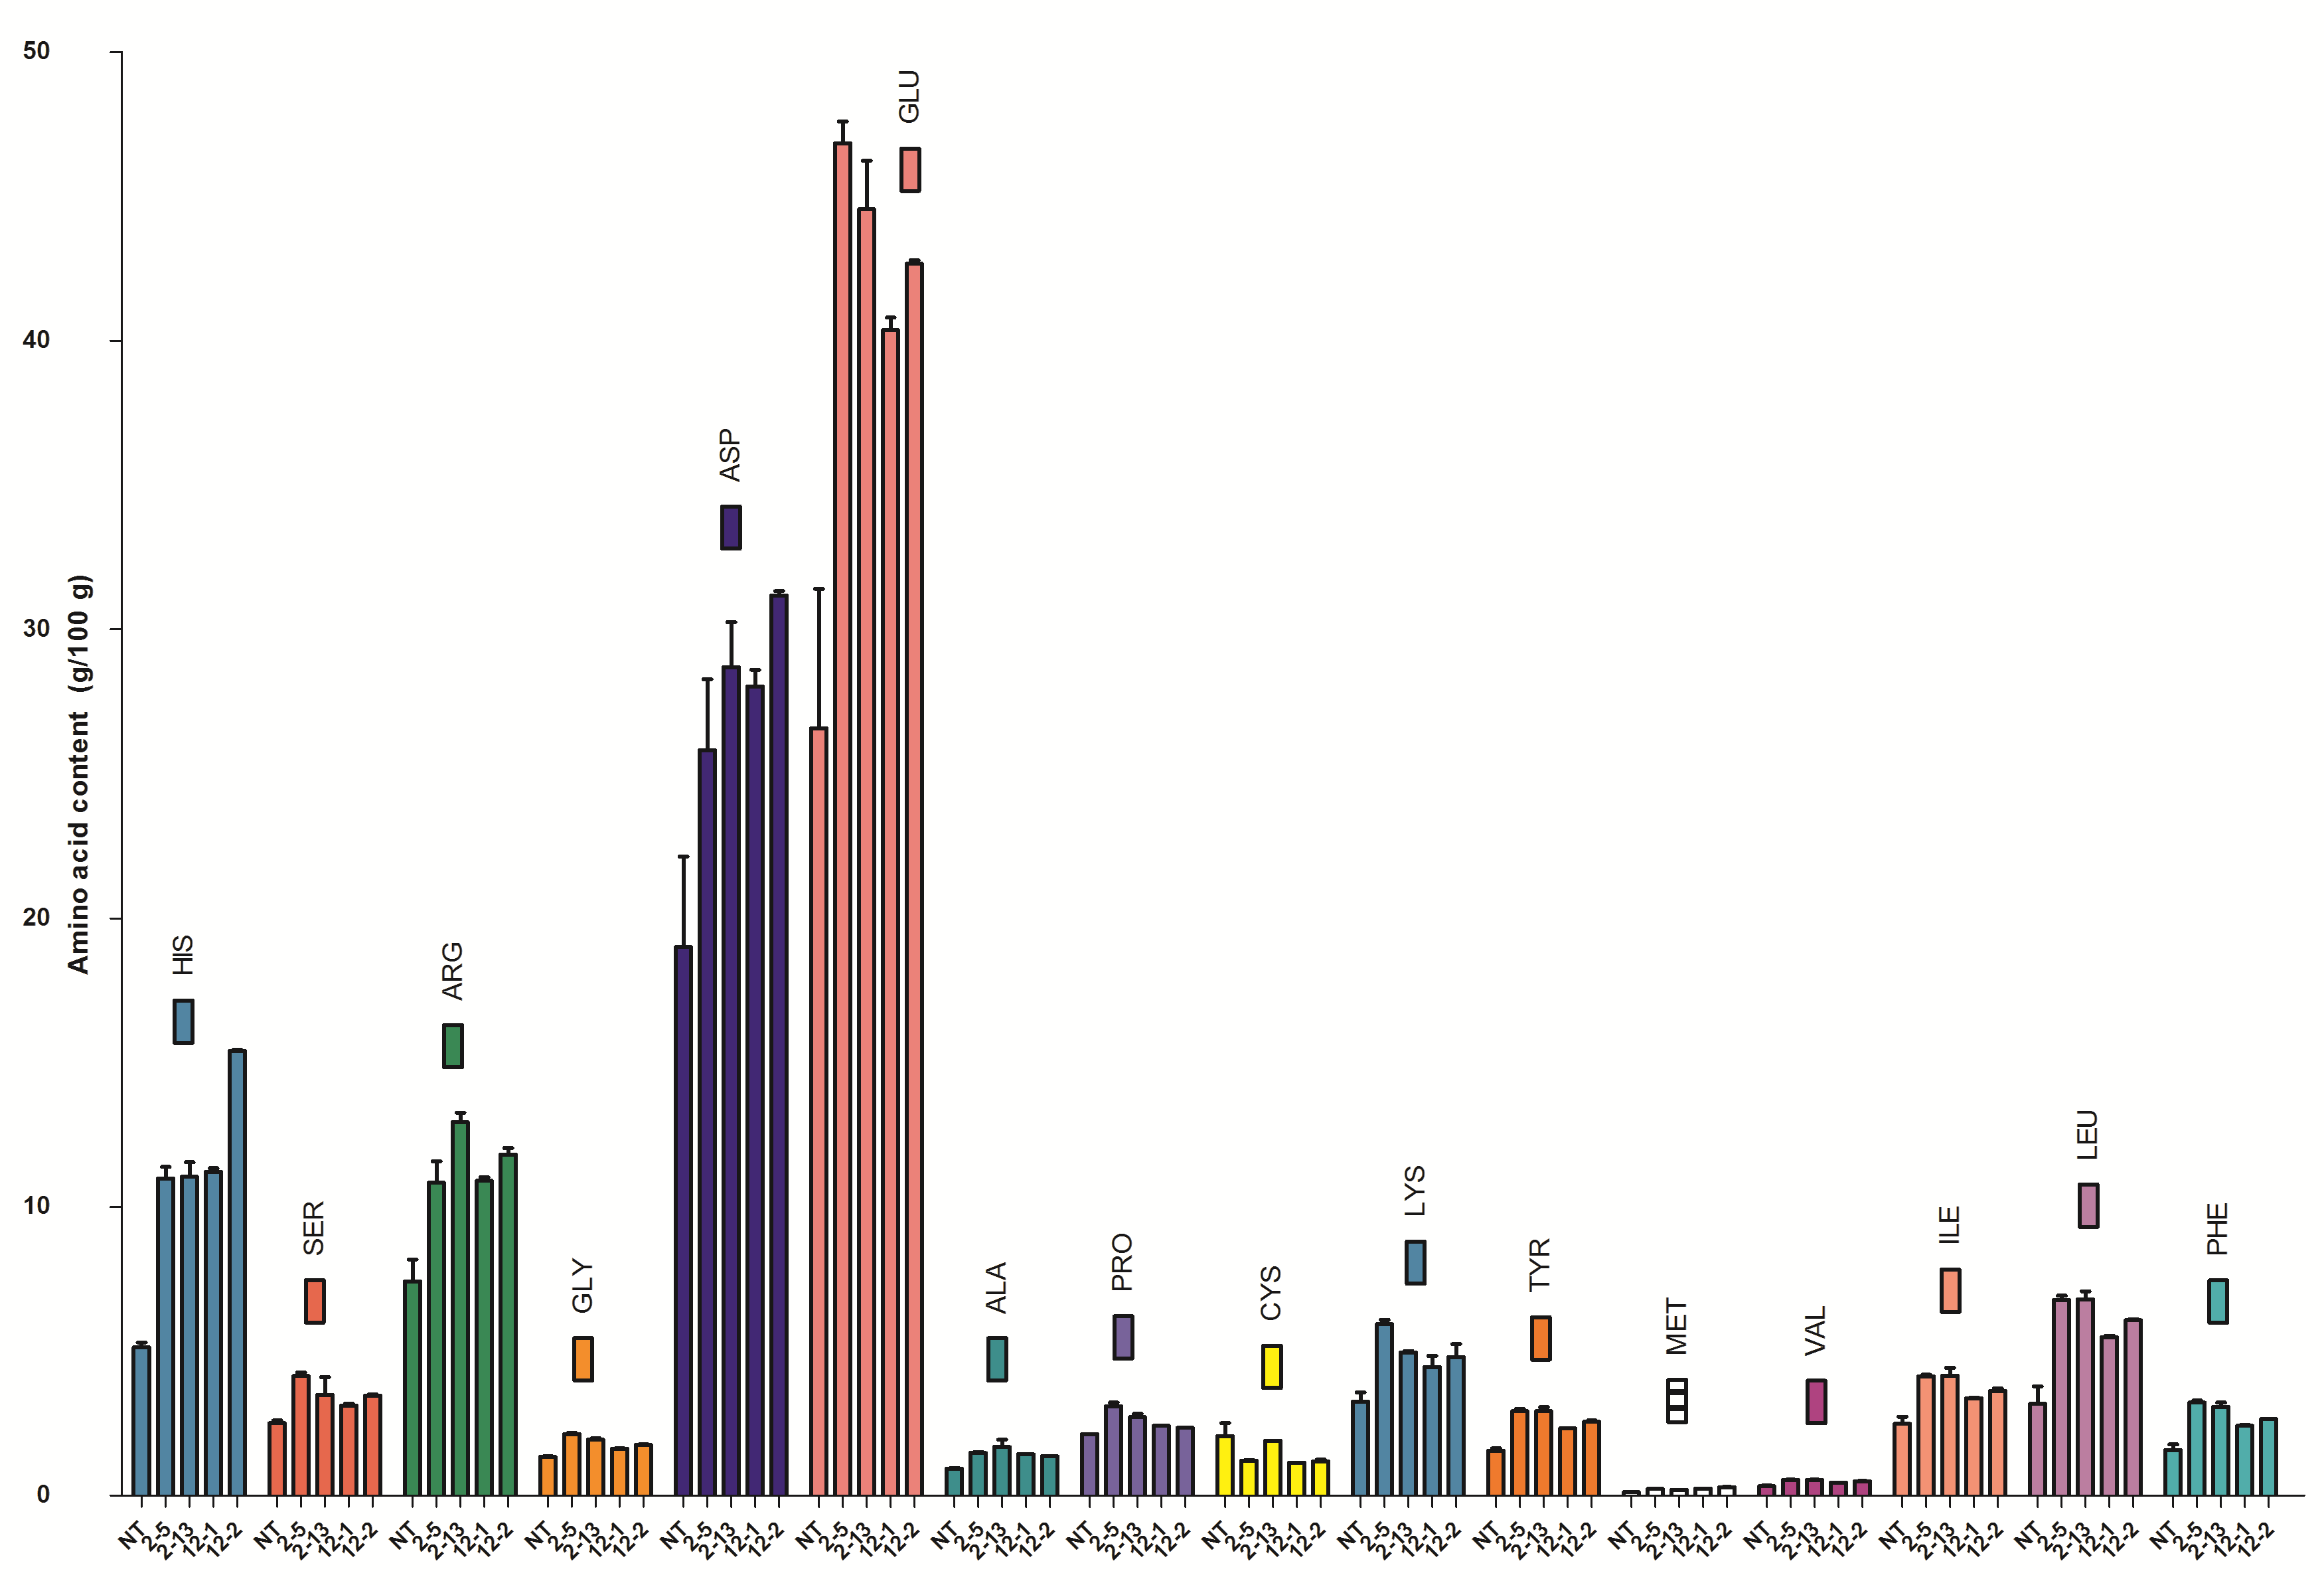
Supplemental Fig. 5. Amino acid content (g/100 g) in non-transgenic and transgenic seeds (T2) by HPLC (AccQ-Tag method).Diagram representing individual amino acid content (g/100 g seed dry weight) of non-transgenic and transgenic rice seeds calculated with respect to amino acid standard. (His- Histidine, Ser- Serine, Arg- Arginine, Gly- Glycine, Asp- Aspartic acid, Glu- Glutamic acid, Ala- Alanine, Pro- Proline, Cys- Cysteine, Lys- Lysine, Tyr- Tyrosine, Met- Methionine, Val- Valine, Ile- Isoleucine, Leu- Leucine, Phe- Phenylalanine). Values are Mean ± SE, n = 3.
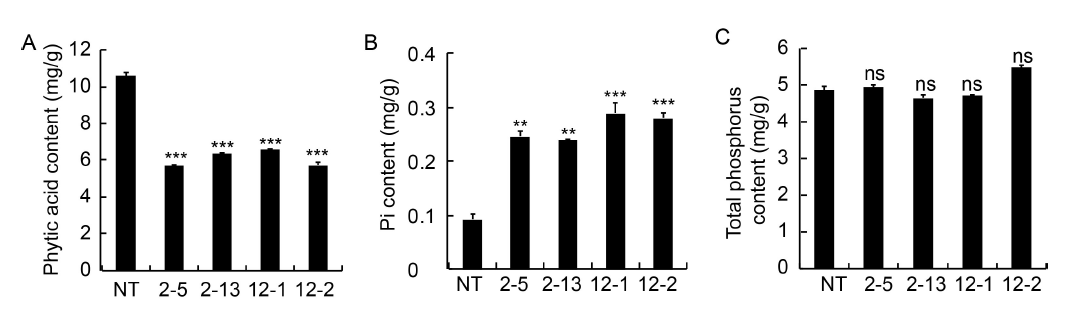
Fig. 2. Analysis of phytic acid (A), inorganic phosphorus (Pi) (B) and total phosphorus (TP) content (C).2-5, 2-13, 12-1 and 12-2 are positive T2 plants IEIT1-2-5, IEIT1-2-13, IEIT1-12-1 and IEIT1-12-2, respectively.Values are presented as Mean ± SE (n = 3). ** and *** indicate significant differences at the 0.05 and 0.001 levels, respectively, and ns indicates non-significant difference at the 0.05 level.
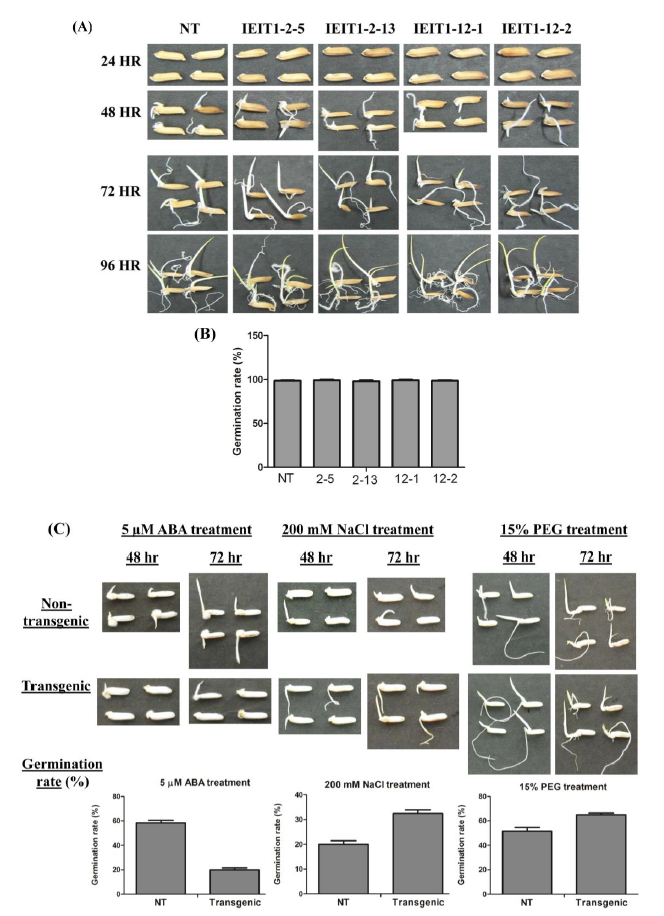
Supplemental Fig. 6. Seed germination analysis.(A) Picture showing the phenotype of non-transgenic and transgenic rice seeds (T2) during germination at different time intervals (24, 48, 72 and 96 hr.). (B) Germination rate (%) of non-transgenic and transgenic seeds after 48 hrs of germination. (C) Germination rate (%) of non-transgenic and transgenic seeds under 5 µM ABA, 200 mM NaCl and 15% PEG treatment. Number of seeds taken is 50. The experiment was repeated thrice.
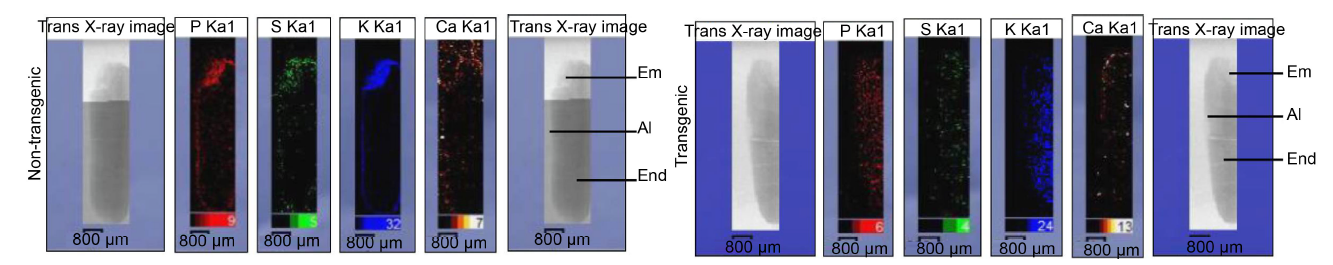
Fig. 3. Comparison of elemental maps of P, S, K and Ca in longitudinal section of entire mature transgenic and non-transgenic seeds of Khitish.Em, Embryo; Al, Aleurone layer; End, Endosperm.
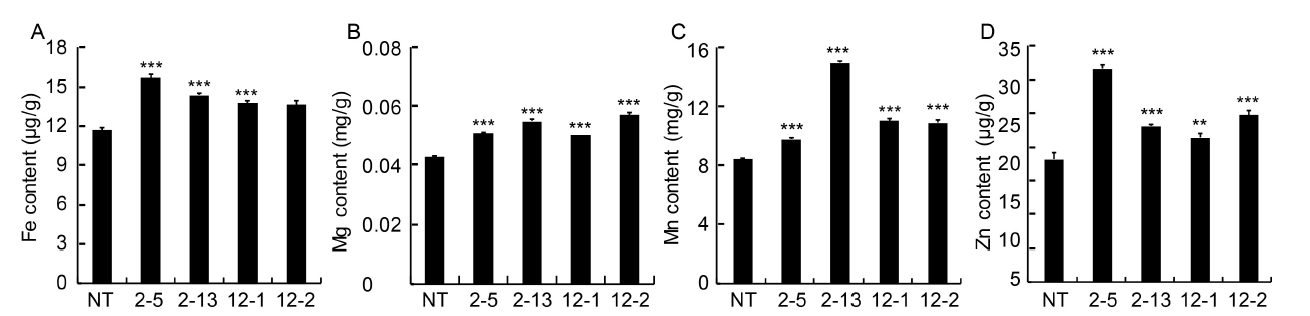
Fig. 4. Analysis of iron (Fe2+) (A), magnesium (Mg2+) (B), manganese (Mn2+) (C) and zinc (Zn2+) (D) content in milled seeds of non-transgenic (NT) and transgenic (T2) seeds by atomic absorption spectroscopy.2-5, 2-13, 12-1 and 12-2 are positive T2 plants IEIT1-2-5, IEIT1-2-13, IEIT1-12-1 and IEIT1-12-2, respectively.Values are presented as Mean ± SE (n = 3). ** and *** indicate significant differences at the 0.01 and 0.001 levels, respectively.
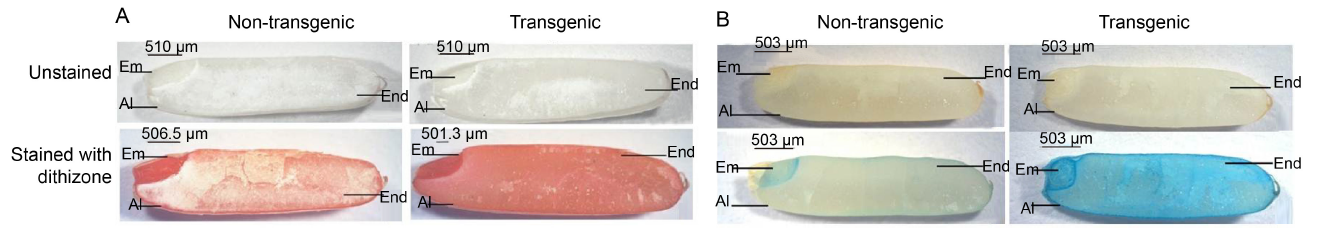
Fig. 5. Histochemical localization of zinc (A) and iron (B) in rice seeds.Em, Embryo; Al, Aleurone layer; End, Endosperm.
| Amino acid | Retention time (min) | NT | IEIT1-2-5 | IEIT1-2-13 | IEIT1-12-1 | IEIT1-12-2 |
|---|---|---|---|---|---|---|
| Alanine | 35.175 | 9.5 ± 0.2 a | 14.8 ± 0.4 a | 16.9 ± 2.6 a | 14.4 ± 0.1 a | 13.7 ± 0.1 a |
| Arginine | 32.910 | 74.3 ± 7.7 a | 108.4 ± 7.5 a | 129.3 ± 3.4 a | 109.0 ± 1.3 a | 118.2 ± 2.1 a |
| Aspartic acid | 14.407 | 189.9 ± 31.4 a | 258.2 ± 24.7 a | 287.0 ± 15.6 a | 280.3 ± 5.8 a | 311.9 ± 1.4 a |
| Cysteine | 48.855 | 20.7 ± 4.6 a | 12.1 ± 0.4 a | 19.0 ± 0.0 a | 11.4 ± 0.2 a | 11.9 ± 0.7 a |
| Glutamic acid | 18.289 | 265.7 ± 48.4 a | 468.4 ± 7.6 a | 445.5 ± 16.9 a | 403.6 ± 4.4 a | 426.8 ± 1.2 a |
| Glycine | 19.783 | 13.5 ± 0.3 a | 21.4 ± 0.5 a | 19.4 ± 0.5 a | 16.3 ± 0.3 a | 17.6 ± 0.2 a |
| Histidine | 22.764 | 51.4 ± 1.7 a | 109.9 ± 4.0 a | 110.4 ± 5.1 a | 112.2 ± 1.3 a | 154.0 ± 0.4 a |
| Isoleucine | 50.597 | 24.9 ± 2.4 a | 41.4 ± 0.5 a | 41.6 ± 2.8 a | 33.7 ± 0.3 a | 36.3 ± 0.8 a |
| Leucine | 51.323 | 31.8 ± 6.1 a | 67.9 ± 1.5 a | 68.1 ± 2.7 a | 55.0 ± 0.5 a | 60.8 ± 0.4 a |
| Lysine | 49.203 | 32.7 ± 3.2 a | 59.4 ± 1.5 a | 49.7 ± 0.4 a | 44.6 ± 3.8 a | 48.0 ± 4.6 a |
| Methionine | 46.585 | 1.2 ± 0.0 a | 2.3 ± 0.1 a | 2.0 ± 0.0 a | 2.5 ± 0.0 a | 2.9 ± 0.2 a |
| Phenylalanine | 52.414 | 15.9 ± 1.9 a | 32.3 ± 0.7 a | 30.7 ± 1.6 a | 24.3 ± 0.3 a | 26.6 ± 0.1 a |
| Proline | 39.149 | 21.4 ± 0.0 a | 31.0 ± 1.3 a | 27.2 ± 1.2 a | 24.2 ± 0.0 a | 23.5 ± 0.0 a |
| Serine | 16.691 | 25.2 ± 0.9 a | 41.4 ± 1.3 a | 34.9 ± 6.1 a | 31.2 ± 0.7 a | 34.7 ± 0.5 a |
| Tyrosine | 44.415 | 15.6 ± 0.9 a | 29.3 ± 0.8 a | 29.3 ± 1.4 a | 23.4 ± 0.0 a | 25.6 ± 0.5 a |
| Valine | 46.440 | 3.3 ± 0.3 a | 5.4 ± 0.1 a | 5.4 ± 0.1 a | 4.5 ± 0.0 a | 5.0 ± 0.0 a |
Table 1 Amino acid content in non-transgenic (NT) and transgenic rice (T2) seeds. mg/g
| Amino acid | Retention time (min) | NT | IEIT1-2-5 | IEIT1-2-13 | IEIT1-12-1 | IEIT1-12-2 |
|---|---|---|---|---|---|---|
| Alanine | 35.175 | 9.5 ± 0.2 a | 14.8 ± 0.4 a | 16.9 ± 2.6 a | 14.4 ± 0.1 a | 13.7 ± 0.1 a |
| Arginine | 32.910 | 74.3 ± 7.7 a | 108.4 ± 7.5 a | 129.3 ± 3.4 a | 109.0 ± 1.3 a | 118.2 ± 2.1 a |
| Aspartic acid | 14.407 | 189.9 ± 31.4 a | 258.2 ± 24.7 a | 287.0 ± 15.6 a | 280.3 ± 5.8 a | 311.9 ± 1.4 a |
| Cysteine | 48.855 | 20.7 ± 4.6 a | 12.1 ± 0.4 a | 19.0 ± 0.0 a | 11.4 ± 0.2 a | 11.9 ± 0.7 a |
| Glutamic acid | 18.289 | 265.7 ± 48.4 a | 468.4 ± 7.6 a | 445.5 ± 16.9 a | 403.6 ± 4.4 a | 426.8 ± 1.2 a |
| Glycine | 19.783 | 13.5 ± 0.3 a | 21.4 ± 0.5 a | 19.4 ± 0.5 a | 16.3 ± 0.3 a | 17.6 ± 0.2 a |
| Histidine | 22.764 | 51.4 ± 1.7 a | 109.9 ± 4.0 a | 110.4 ± 5.1 a | 112.2 ± 1.3 a | 154.0 ± 0.4 a |
| Isoleucine | 50.597 | 24.9 ± 2.4 a | 41.4 ± 0.5 a | 41.6 ± 2.8 a | 33.7 ± 0.3 a | 36.3 ± 0.8 a |
| Leucine | 51.323 | 31.8 ± 6.1 a | 67.9 ± 1.5 a | 68.1 ± 2.7 a | 55.0 ± 0.5 a | 60.8 ± 0.4 a |
| Lysine | 49.203 | 32.7 ± 3.2 a | 59.4 ± 1.5 a | 49.7 ± 0.4 a | 44.6 ± 3.8 a | 48.0 ± 4.6 a |
| Methionine | 46.585 | 1.2 ± 0.0 a | 2.3 ± 0.1 a | 2.0 ± 0.0 a | 2.5 ± 0.0 a | 2.9 ± 0.2 a |
| Phenylalanine | 52.414 | 15.9 ± 1.9 a | 32.3 ± 0.7 a | 30.7 ± 1.6 a | 24.3 ± 0.3 a | 26.6 ± 0.1 a |
| Proline | 39.149 | 21.4 ± 0.0 a | 31.0 ± 1.3 a | 27.2 ± 1.2 a | 24.2 ± 0.0 a | 23.5 ± 0.0 a |
| Serine | 16.691 | 25.2 ± 0.9 a | 41.4 ± 1.3 a | 34.9 ± 6.1 a | 31.2 ± 0.7 a | 34.7 ± 0.5 a |
| Tyrosine | 44.415 | 15.6 ± 0.9 a | 29.3 ± 0.8 a | 29.3 ± 1.4 a | 23.4 ± 0.0 a | 25.6 ± 0.5 a |
| Valine | 46.440 | 3.3 ± 0.3 a | 5.4 ± 0.1 a | 5.4 ± 0.1 a | 4.5 ± 0.0 a | 5.0 ± 0.0 a |
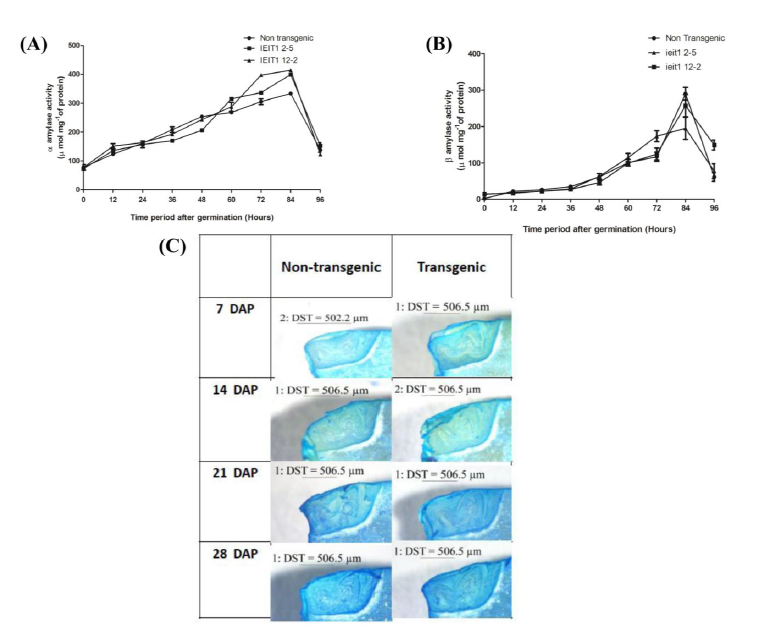
Supplemental Fig. 7. Study of internal structure of seed and enzyme activity analysis during germination.Enzyme activity analysis of (A) α- amylase and (B) β-amylase during germination at different time intervals in transgenic (T2) and non-transgenic control seeds showing no significant difference. The open circle represent response of non-transgenic (NT) and open squares and triangles represent response of transgenics. (C) Longitudinal section of non-transgenic and transgenic embryos (T2) of different transgenic plant lines at different stages of development (7, 14, 21 and 28 DAP) stained with 0.05% Toluidine blue (DAP - Days after pollination) (2X optical zoom, resolution-2592×1944).
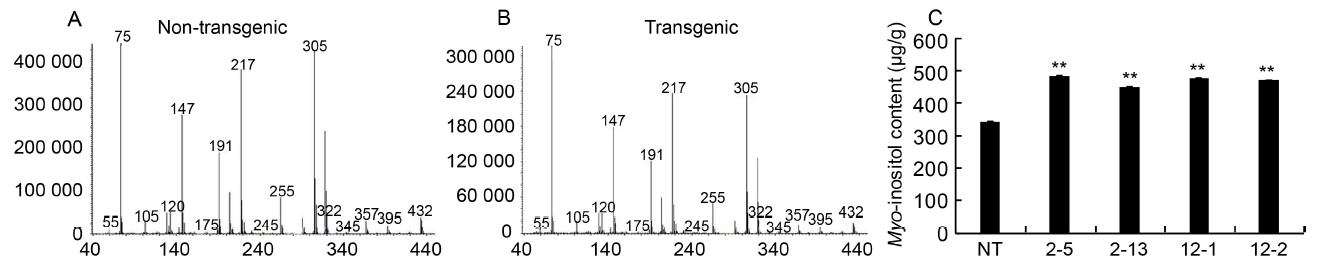
Fig. 6. Myo-inositol content of seed by gas chromatography-mass spectrometer analysis.A and B, Mass-fragmentation pattern of non-transgenic and transgenic seeds as observed in GC-MS analysis. Myo-inositol was estimated as hexatrimethylsilyl ether derivative and identified by comparing the mass fragmentation pattern in the database library NBS75K. C, Myo-inositol content of transgenic seeds (T2) as compared to non-transgenic (NT) seeds.2-5, 2-13, 12-1 and 12-2 are positive T2 plants IEIT1-2-5, IEIT1-2-13, IEIT1-12-1 and IEIT1-12-2, respectively.Values are presented as Mean ± SE (n = 3). ** indicates significant difference at the 0.01 level.
| Trait | NT | IEIT1-2-5 | IEIT1-2-13 | IEIT1-12-1 | IEIT1-12-2 |
|---|---|---|---|---|---|
| Plant height (cm) | 118.33 ± 0.88 ab | 117.67 ± 1.45 ab | 122.67 ± 0.88 b | 119.00 ± 1.73 ab | 118.33 ± 0.88 ab |
| No. of tillers per plant | 9.00 ± 0.58 ab | 10.33 ± 0.88 ab | 9.67 ± 1.20 ab | 9.33 ± 0.88 ab | 9.00 ± 0.58 ab |
| Panicle length (cm) | 28.33 ± 0.88 ab | 26.67 ± 1.20 ab | 27.67 ± 1.20 ab | 23.67 ± 0.88 b | 27.33 ± 0.88 ab |
| No. of grains per panicle | 205.33 ± 2.91 ab | 213.67 ± 1.86 a | 233.33 ± 1.67 a | 205.00 ± 2.89 ab | 197.67 ± 1.45 b |
| Seed length (mm) | 9.76 ± 0.02 ab | 9.86 ± 0.02 ab | 9.71 ± 0.06 ab | 9.68 ± 0.05 ab | 9.79 ± 0.02 ab |
| Seed width (mm) | 2.19 ± 0.03 ab | 2.62 ± 0.04 a | 2.48 ± 0.02 a | 2.37 ± 0.02 ab | 2.35 ± 0.04 ab |
| Seed length/width ratio | 4.45 ± 0.06 ab | 3.76 ± 0.06 b | 3.92 ± 0.05 b | 4.09 ± 0.05 b | 4.17 ± 0.08 ab |
| 1000-grain weight (g) | 17.69 ± 0.25 ab | 16.28 ± 0.08 ab | 17.93 ± 0.12 ab | 16.65 ± 0.14 ab | 15.24 ± 0.11 b |
Table 2 Phenotypic evaluation of low phytate transgenic (T1) and non-transgenic (NT) plants under greenhouse conditions.
| Trait | NT | IEIT1-2-5 | IEIT1-2-13 | IEIT1-12-1 | IEIT1-12-2 |
|---|---|---|---|---|---|
| Plant height (cm) | 118.33 ± 0.88 ab | 117.67 ± 1.45 ab | 122.67 ± 0.88 b | 119.00 ± 1.73 ab | 118.33 ± 0.88 ab |
| No. of tillers per plant | 9.00 ± 0.58 ab | 10.33 ± 0.88 ab | 9.67 ± 1.20 ab | 9.33 ± 0.88 ab | 9.00 ± 0.58 ab |
| Panicle length (cm) | 28.33 ± 0.88 ab | 26.67 ± 1.20 ab | 27.67 ± 1.20 ab | 23.67 ± 0.88 b | 27.33 ± 0.88 ab |
| No. of grains per panicle | 205.33 ± 2.91 ab | 213.67 ± 1.86 a | 233.33 ± 1.67 a | 205.00 ± 2.89 ab | 197.67 ± 1.45 b |
| Seed length (mm) | 9.76 ± 0.02 ab | 9.86 ± 0.02 ab | 9.71 ± 0.06 ab | 9.68 ± 0.05 ab | 9.79 ± 0.02 ab |
| Seed width (mm) | 2.19 ± 0.03 ab | 2.62 ± 0.04 a | 2.48 ± 0.02 a | 2.37 ± 0.02 ab | 2.35 ± 0.04 ab |
| Seed length/width ratio | 4.45 ± 0.06 ab | 3.76 ± 0.06 b | 3.92 ± 0.05 b | 4.09 ± 0.05 b | 4.17 ± 0.08 ab |
| 1000-grain weight (g) | 17.69 ± 0.25 ab | 16.28 ± 0.08 ab | 17.93 ± 0.12 ab | 16.65 ± 0.14 ab | 15.24 ± 0.11 b |
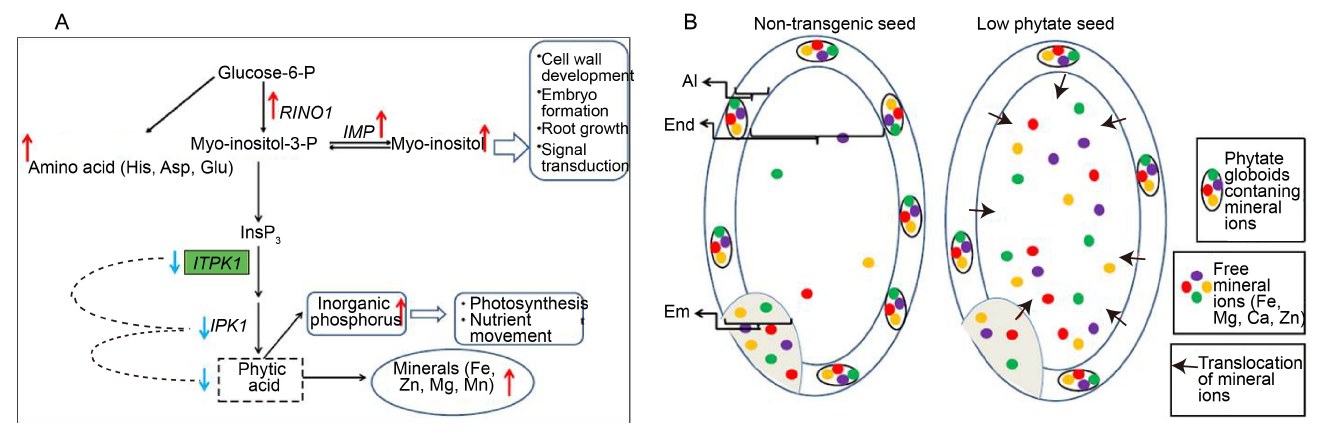
Fig. 7. Effect of silencing ITP5/6K-1 on phytic acid biosynthesis pathway and distribution of mineral ions in seed.A, Hypothetical model depicting effect of down-regulation of OsITP5/6K-1 gene on different phytic acid pathway enzymes and metabolites. Red arrow indicates up-regulation, Blue arrow indicates down-regulation. B, Diagram depicting mechanism in translocation of mineral ions in low phytate transgenic seeds. Em, Embryo; Al, Aleurone layer; End, Endosperm.
| [1] | Ali N, Paul S, Gayen D, Sarkar S N, Datta K, Datta S K. 2013a. RNAi mediated down regulation of myo-inositol-3-phosphate synthase to generate low phytate rice. Rice, 6: 12. |
| [2] | Ali N, Paul S, Gayen D, Sarkar S N, Datta K, Datta S K. 2013b. Development of low phytate rice by RNAi mediated seed- specific silencing of inositol 1,3,4,5,6-pentakisphosphate 2-kinase gene ( IPK1). PLoS One, 8: e68161. |
| [3] | Aggarwal S, Kumar A, Bhati K K, Kaur G, Shukla V, Tiwari S, Pandey A K. 2018. RNAi-mediated downregulation of inositol pentakisphosphate kinase (IPK1) in wheat grains decreases phytic acid levels and increases Fe and Zn accumulation. Front Plant Sci, 9: 259. |
| [4] | Bernfeld P.1955. Amylases α and β. In: Colowick S P, Kalpan N O. Methods in Enzymology. New York: Academic Press: 149-158. |
| [5] | Bohn L, Meyer A S, Rasmussen S K. 2008. Phytate: Impact on environment and human nutrition. A challenge for molecular breeding. J Zhejiang Univ: Sci B, 9(3): 165-191. |
| [6] | Bradford M M. 1976. A rapid and sensitive method for the quantitation of microgram quantities of protein utilizing the principle of protein-dye binding. Anal Biochem, 72: 248-254. |
| [7] | Bregitzer P, Raboy V. 2006. Effects of four independent low- phytate mutations in barley ( Hordeum vulgare L.) on seed phosphorus characteristics and malting quality. Cereal Chem, 83(5): 460-464. |
| [8] | Chen P S, Toribara T Y, Warner H. 1956. Microdetermination of phosphorus. Anal Chem, 28: 1756-1758. |
| [9] | Coelho C M M, Tsai S M, Vitorello V A. 2005. Dynamics of inositol phosphate pools (tris-, tetrakis- and pentakisphosphate) in relation to the rate of phytate synthesis during seed development in common bean ( Phaseolus vulgaris). J Plant Physiol, 162(1): 1-9. |
| [10] | Datta K, Koukolikova-Nicola Z, Baisakh N, Oliva N, Datta S K. 2000. Agrobacterium-mediated engineering for sheath blight resistance of indica rice cultivars from different ecosystems. Theor Appl Genet, 100(6): 832-839. |
| [11] | Drakakaki G, Marcel S, Glahn R P, Lund E K, Pariagh S, Fischer R, Christou P, Stoger E. 2005. Endosperm-specific co-expression of recombinant soybean ferritin and Aspergillus phytase in maize results in significant increases in the levels of bioavailable iron. Plant Mol Biol, 59(6): 869-880. |
| [12] | Duarte R F, Prom-u-thai C, Amaral D C, Faquin V, Guilherme L R G, Reis A R, Alves E. 2016. Determination of zinc in rice grains using DTZ staining and ImageJ software. J Cereal Sci, 68: 53-58. |
| [13] | Feng X G, Yoshida K T. 2004. Molecular approaches for producing low-phytic-acid grains in rice. Plant Biotechnol, 21(3): 183-189. |
| [14] | Furtado A, Henry R J. 2005. The wheat Em promoter drives reporter gene expression in embryo and aleurone tissue of transgenic barley and rice. Plant Biotechnol J, 3(4): 421-434. |
| [15] | Galani S, Aman A, Qader S A U. 2011. Germination potential index of Sindh rice cultivars on biochemical basis, using amylase as an indicator. Afr J Biotechnol, 10: 18334-18338. |
| [16] | Huang N, Angeles E R, Domingo J, Magpantay G, Singh S, Zhang G, Kumaravadivel N, Bennet J, Khush G S. 1997. Pyramiding of bacterial blight resistance genes in rice: Marker-assisted selection using RFLP and PCR. Theor Appl Genet, 95(3): 313-320. |
| [17] | Karmakar S, Molla K A, Chanda P K, Sarkar S N, Datta S K, Datta K. 2016. Green tissue-specific co-expression of chitinase and oxalate oxidase 4 genes in rice for enhanced resistance against sheath blight. Planta, 243(1): 115-130. |
| [18] | Kaur H, Verma P, Petla B P, Rao V, Saxena S C, Majee M. 2013. Ectopic expression of the ABA-inducible dehydration-responsive chickpea L-myo-inositol 1-phosphate synthase 2 (CaMIPS2) in Arabidopsis enhances tolerance to salinity and dehydration stress. Planta, 237(1): 321-335. |
| [19] | Kim S, Tai T. 2011. Identification of genes necessary for wild-type levels of seed phytic acid in Arabidopsis thaliana using a reverse genetics approach. Mol Genet Genom, 286(2): 119-133. |
| [20] | Kuwano M, Ohyama A, Tanaka Y, Mimura T, Takaiwa F, Yoshida K T. 2006. Molecular breeding for transgenic rice with low- phytic-acid phenotype through manipulating myo-inositol 3-phosphate synthase gene. Mol Breeding, 18(3): 263-272. |
| [21] | Kuwano M, Mimura T, Takaiwa F, Yoshida K T. 2009. Generation of stable ‘low phytic acid’ transgenic rice through antisense repression of the 1D- myo-inositol 3-phosphate synthase gene(RINO1) using the 18-kDa oleosin promoter. Plant Biotechnol J, 7(1): 96-105. |
| [22] | Larson S R, Rutger J N, Young K A, Raboy V. 2000. Isolation and genetic mapping of a non-lethal rice ( Oryza sativa L.) low phytic acid 1 mutation. Crop Sci, 40: 1397-1405. |
| [23] | Liu J C, Ockenden I, Truax M, Lott J N A. 2004. Phytic acid- phosphorus and other nutritionally important mineral nutrient elements in grains of wild-type and low phytic acid (lpa1-1) rice. Seed Sci Res, 14(2): 109-116. |
| [24] | Liu Q L, Xu X H, Ren X L, Fu H W, Wu D X, Shu Q Y. 2007. Generation and characterization of low phytic acid germplasm in rice ( Oryza sativa L.). Theor Appl Genet, 114(5): 803-814. |
| [25] | Livak K J, Schmitteng T D. 2001. Analysis of relative gene expression data using a real-time quantitative PCR and 2-ΔΔCT method. Methods, 25(4): 402-408. |
| [26] | Loewus F A, Murthy P P N. 2000. myo-Inositol metabolism in plants. Plant Sci, 150: 1-19. |
| [27] | Lott J N A, Greenwood J S, Batten G D. 1995. Mechanisms and regulation of mineral nutrient storage during seed development. In: Kigel J, Galili G. Seed Development and Germination. New York: Marcel Dekker: 215-235. |
| [28] | Lucca P, Hurrell R, Potrykus I. 2001. Genetic engineering approaches to improve the bioavailability and the level of iron in rice grains. Theor Appl Genet, 102: 392-397. |
| [29] | Miller G L. 1959. Use of dinitrosalicylic acid reagent for determination of reducing sugar. Anal Chem, 31: 426-428. |
| [30] | Molla K A, Karmakar S, Chanda P K, Ghosh S, Sarkar S N, Datta S K, Datta K. 2013. Rice oxalate oxidase gene driven by green tissue-specific promoter increases tolerance to sheath blight pathogen (Rhizoctonia solani) in transgenic rice. Mol Plant Pathol, 14(9): 910-922. |
| [31] | Pilu R, Panzeri D, Gavazzi G, Rasmussen S K, Consonni G, Nielsen E. 2003. Phenotypic, genetic and molecular characterization of a maize low phytic acid mutant ( lpa 241). Theor Appl Genet, 107(6): 980-987. |
| [32] | Raboy V, Gerbasi P F, Young K A, Stoneberg S D, Pickett S G, Bauman A T, Murthy P P N, Sheridan W F, Ertl D S. 2000. Origin and seed phenotype of maize low phytic acid 1-1 and low phytic acid 2-1. Plant Physiol, 124(1): 355-368. |
| [33] | Raboy V. 2003. myo-Inositol-1,2,3,4,5,6-hexakisphosphate. Phytochemistry, 64(6): 1033-1043. |
| [34] | Raboy V. 2009. Approaches and challenges to engineering seed phytate and total phosphorus. Plant Sci, 177(4): 281-296. |
| [35] | Raj Bhandari M, Kawabata J. 2006. Cooking effects on oxalate, phytate, trypsin and alpha amylase inhibitors of wild type yam tubers of Nepal. J Food Compos Anal, 19: 524-530. |
| [36] | Sakai H, Iwai T, Matsubara C, Usui Y, Okamura M, Yatou O, Tarada Y, Aoki N, Nishida S, Yoshida K T. 2015. A decrease in phytic acid content substantially affects the distribution of mineral elements within rice seeds. Plant Sci, 238: 170-177. |
| [37] | Shi J R, Wang H Y, Hazebroek J, Ertl D S, Harp T. 2005. The maize low-phytic acid 3 encodes a myo-inositol kinase that plays a role in phytic acid biosynthesis in developing seeds. Plant J, 42(5): 708-719. |
| [38] | Shi J R, Wang H Y, Schellin K, Li B L, Faller M, Stoop J M, Meeley R B, Ertl D S, Ranch J P, Glassman K. 2007. Embryo- specific silencing of a transporter reduces phytic acid content of maize and soybean seeds. Nat Biotechnol, 25: 930-937. |
| [39] | Sivaprakash K R, Krishnan S, Datta S K, Parida A K. 2006. Tissue-specific histochemical localization of iron and ferritin gene expression in transgenic indica rice Pusa Basmati ( Oryza sativa L.). J Genet, 85(2): 157-160. |
| [40] | Sparvoli F, Cominelli E. 2015. Seed biofortification and phytic acid reduction: A conflict of interest for the plant? Plants, 4(4): 728-755. |
| [41] | Stein N, Herren G, Keller B. 2001. A new DNA extraction method for high-throughput marker analysis in a large-genome species such as Triticum aestivum. Plant Breeding, 120(4): 354-356. |
| [42] | Suzuki M, Tanaka K, Kuwano M, Yoshida K T. 2007. Expression pattern of inositol phosphate-related enzymes in rice ( Oryza sativa L.): Implications for the phytic acid biosynthetic pathway. Gene, 405: 55-64. |
| [43] | Woo L, Maher W. 1995. Determination of phosphorus in turbid waters using alkaline potassium peroxodisulphate digestion. Anal Chim Acta, 315(1): 123-135. |
| [1] | Kaur Maninder, Asthir Bavita, Mahajan Gulshan. Variation in Antioxidants, Bioactive Compounds and Antioxidant Capacity in Germinated and Ungerminated Grains of Ten Rice Cultivars [J]. Rice Science, 2017, 24(6): 349-359. |
| [2] | WU Wei, CHENG Fang-min, LIU Zheng-hui, WEI Ke-su. Difference of Phytic Acid Content and its Relation to Four Protein Composition Contents in Grains of Twenty-nine japonica Rice Varieties from Jiangsu and Zhejiang Provinces, China [J]. RICE SCIENCE, 2007, 14(4): 311-314 . |
| Viewed | ||||||
|
Full text |
|
|||||
|
Abstract |
|
|||||